Why tag transactions?
Estimates are useful, but real bank data is better. Every transaction you tag flows into the property’s statement grid as a confirmed figure, shown there with a green TX badge, and feeds the cashflow, yield, and tax estimates. The more you tag, the less the grid has to guess.
Choose where the transactions come from
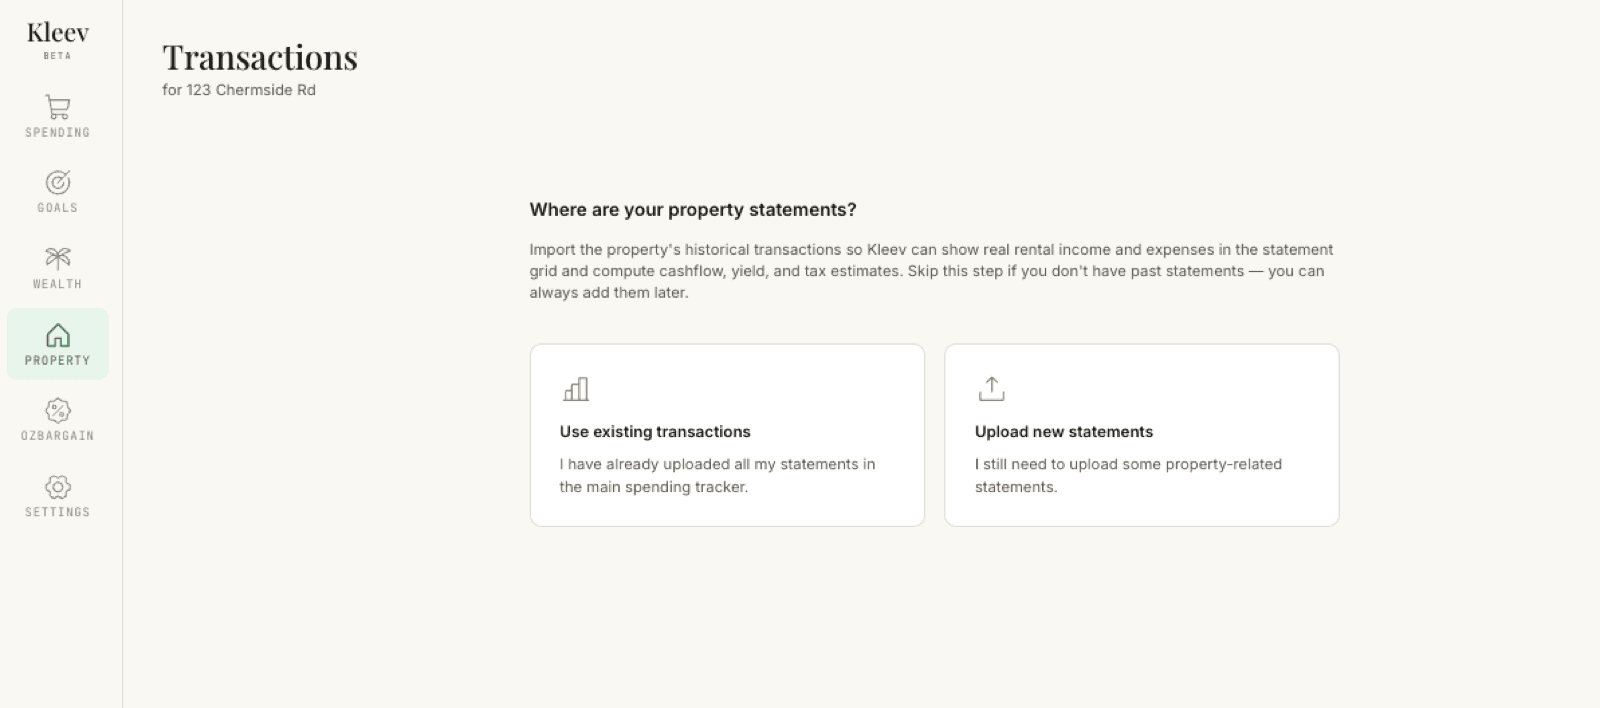
Open Transactions from your property’s page. Kleev asks Where are your property statements? Importing the property’s historical transactions is what lets it show real rental income and expenses in the statement grid and compute cashflow, yield, and tax estimates. Two tiles:
- Use existing transactions: “I have already uploaded all my statements in the main spending tracker.” Kleev picks from what’s already imported.
- Upload new statements: “I still need to upload some property-related statements.” Drop in CSV files you haven’t imported yet (for example, a separate account you only use for the property).
No past statements? Skip this step; you can always add them later (there’s a Skip this step button in the bottom bar).
Review the AI suggestions
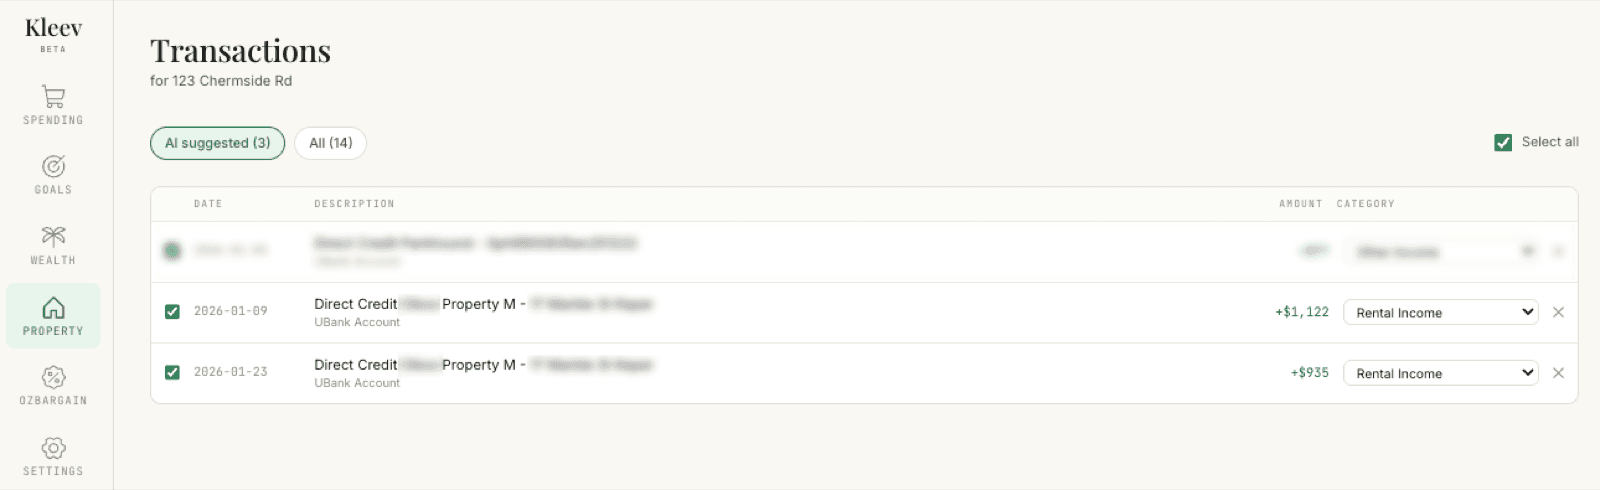
Kleev scans your transactions for property-related items (rent deposits, council rates, water bills, strata payments) and opens on the AI suggested filter with its count, like AI suggested (3) here. Suggestions arrive ready to go:
- Each suggested row is pre-ticked with a category already picked in its dropdown; in this example, two rent deposits (+$1,122 and +$935) pre-set to Rental Income. Adjust the dropdown if the AI guessed wrong: income types like Rental Income, expense types like Council Rates or Maintenance and Repairs, or + Custom to type your own label.
- Select all in the top-right ticks or unticks everything in the current filter at once.
- Anything already tagged to this property shows greyed out with a Tagged chip beside its description, and is left out of the selection, so coming back with new statements can’t double-tag it.
- Click ✕ on anything that isn’t property-related. The row disappears, and Kleev remembers that description so it won’t suggest it for this property again.
Tag anything the AI missed
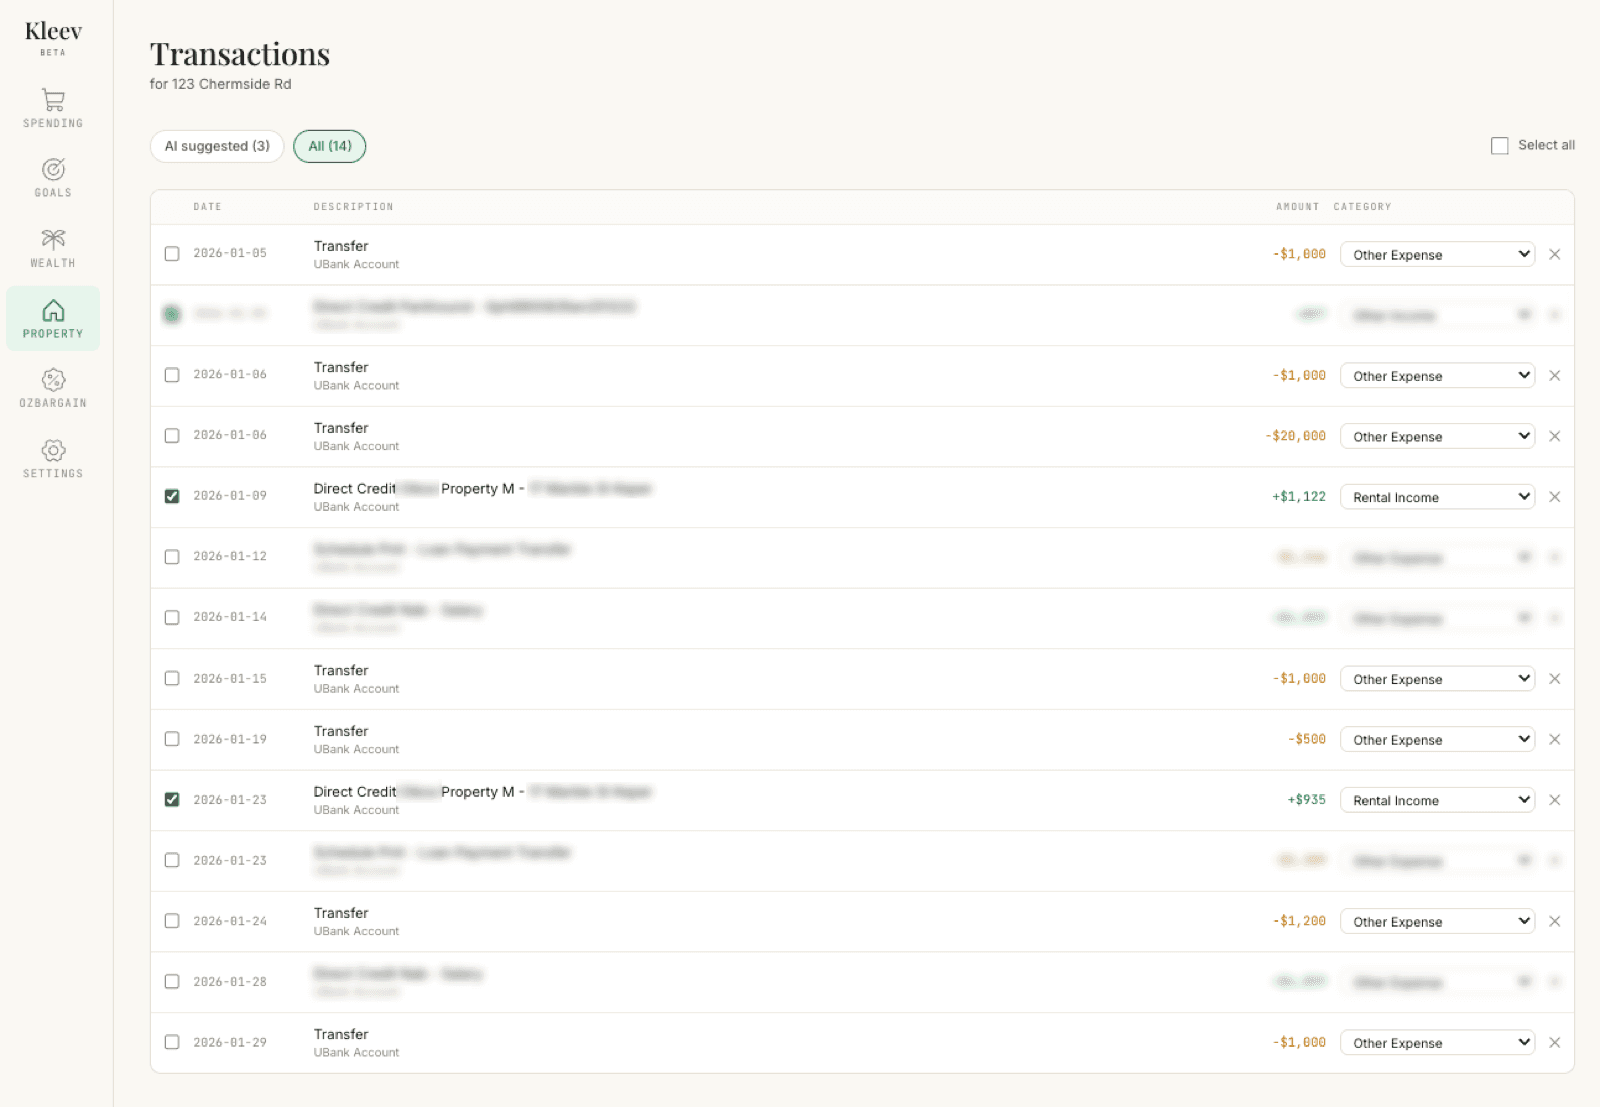
Switch to the All filter (All (14) here) to browse every imported transaction: transfers, salary, the lot. These rows start unticked with their category dropdown defaulting to Other Expense. To tag one manually, tick its checkbox and pick the right category. Anything you selected under AI suggested stays ticked with its category, so you can mix and match between the two views before saving.
Save
Click Save N transactions in the bottom bar. The tagged amounts appear in the statement grid against their month and category immediately.
See it in the grid
Here’s the payoff. In the Property Statement Grid, every cell carries a small badge naming its source. Months with no tagged data fall back to your configured rent, here 2,816.67 a month with a CFG badge. But 2026-01, the month the two tagged rent deposits landed, shows their real total of 2,056.79 with a green TX badge instead; the tagged bank data replaces the configured estimate for that month, and Total Income picks up 2,056.79 rather than the estimate.