The quick checklist
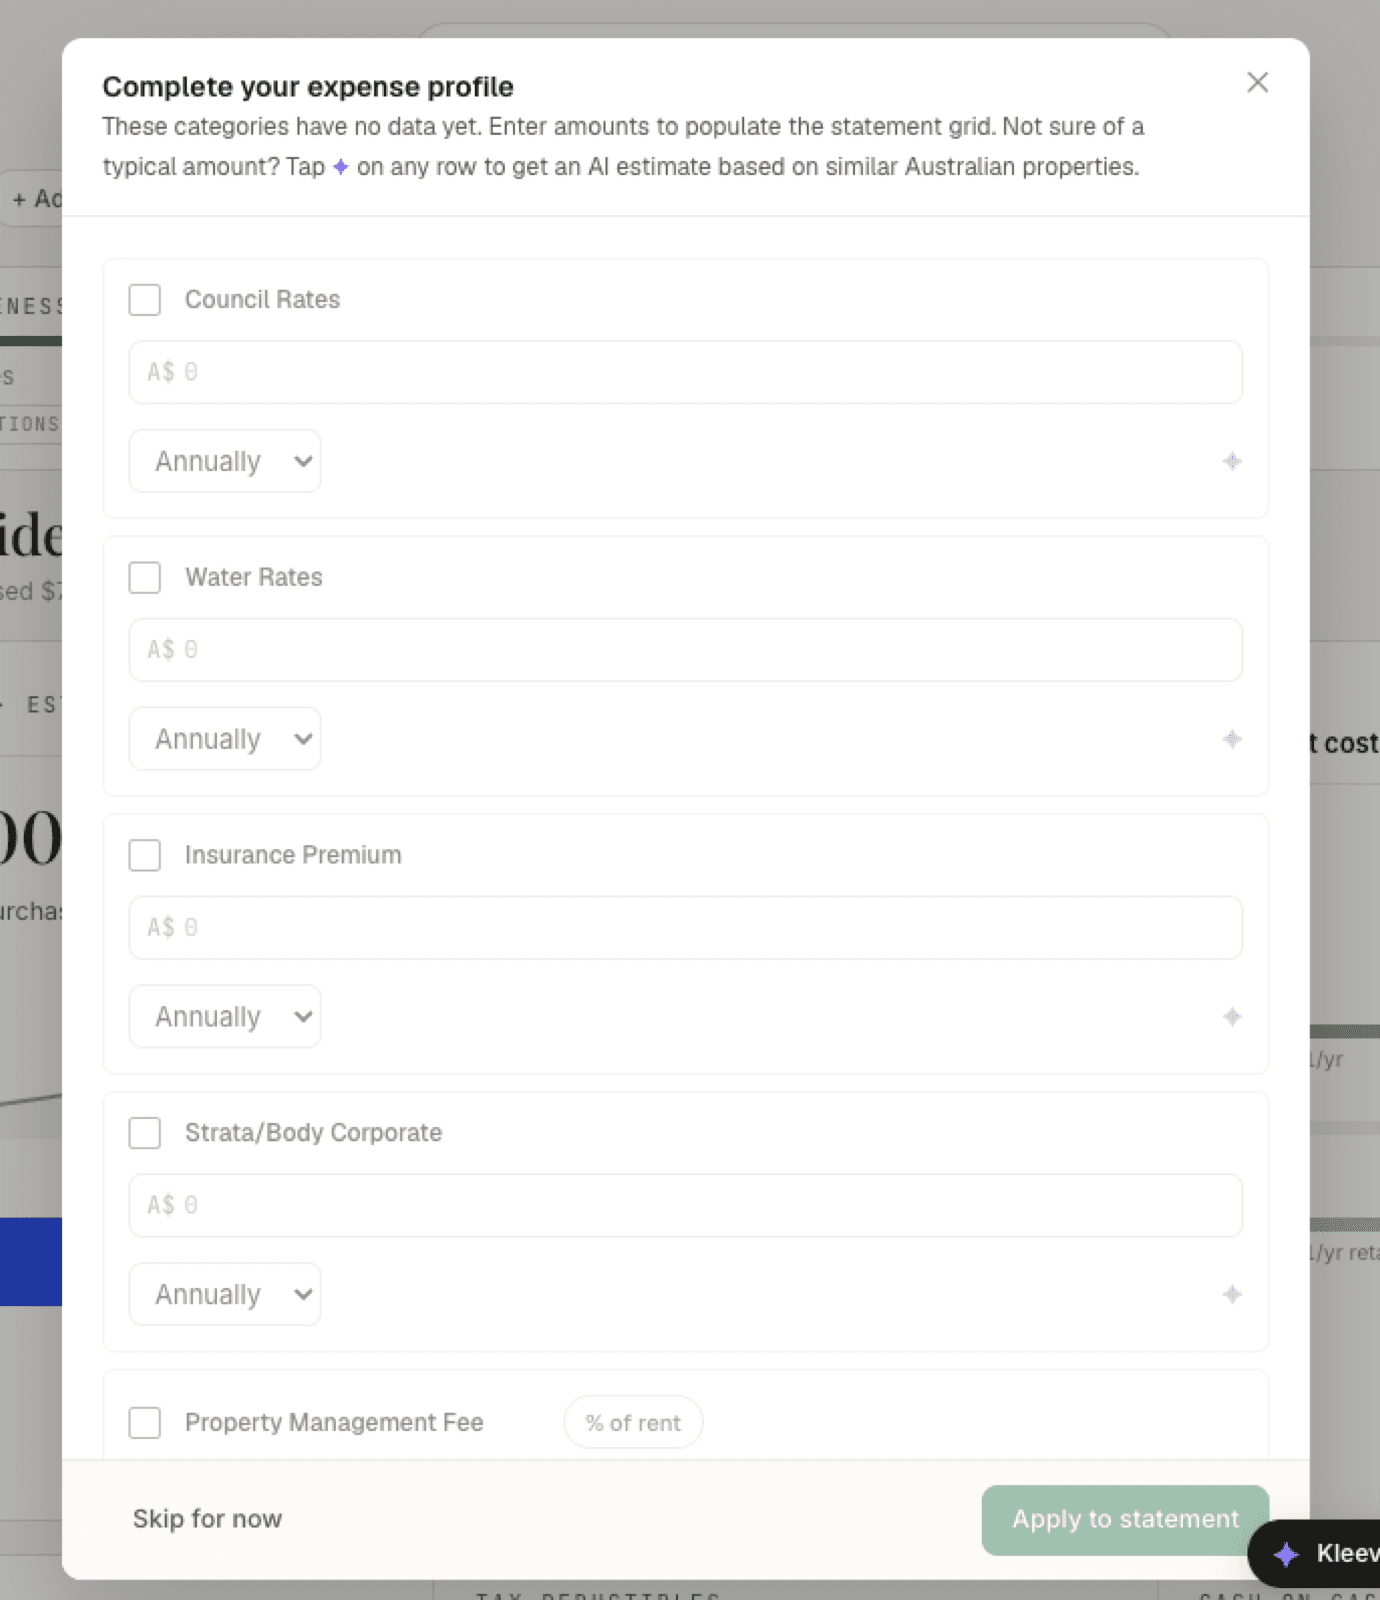
When expense categories in your statement grid have no data yet, Kleev offers a checklist titled Complete your expense profile. The intro says it plainly: “These categories have no data yet. Enter amounts to populate the statement grid. Not sure of a typical amount? Tap ✦ on any row to get an AI estimate based on similar Australian properties.” You can also reopen it any time from the grid’s cog menu via Edit expenses.
Each row is one expense category (Council Rates, Water Rates, Insurance Premium, Strata/Body Corporate, Property Management Fee), and every row has the same four parts: a checkbox, an A$ amount field, a frequency select, and a violet ✦ AI-estimate button. For each expense you actually have:
- Tick the row.
- Type the amount.
- Pick how often you pay it: Weekly, Monthly, Quarterly, or Annually. Kleev converts everything to a monthly figure for the grid.
Leave rows you don’t have unticked. Two buttons sit in the footer: Skip for now closes the checklist without changing anything, and Apply to statement writes your amounts into the grid. It stays disabled until at least one ticked row has an amount.
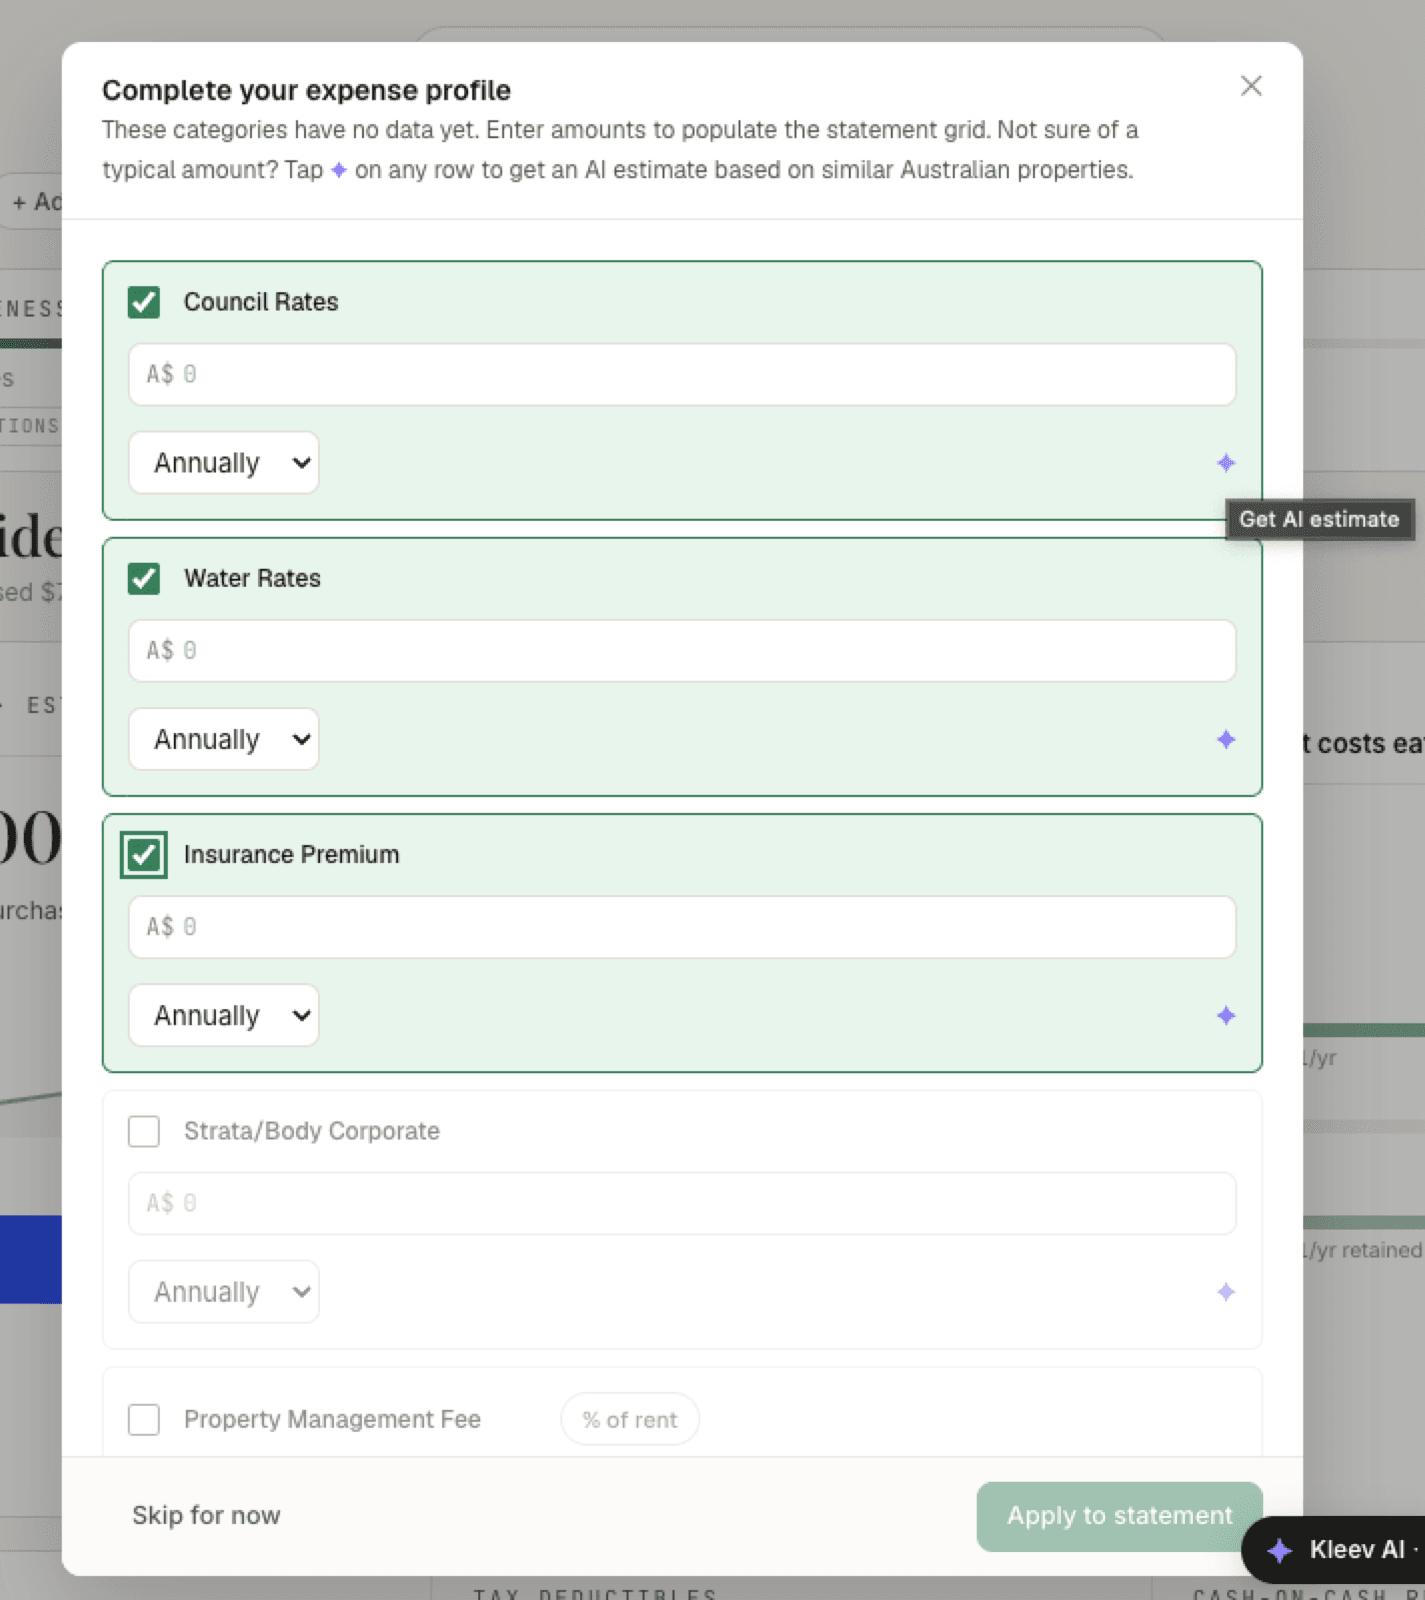
AI estimates vs your own numbers
Not sure what a typical amount is? Hover the violet ✦ on any row (the tooltip reads Get AI estimate) and tap it. Kleev suggests a figure based on similar Australian properties.
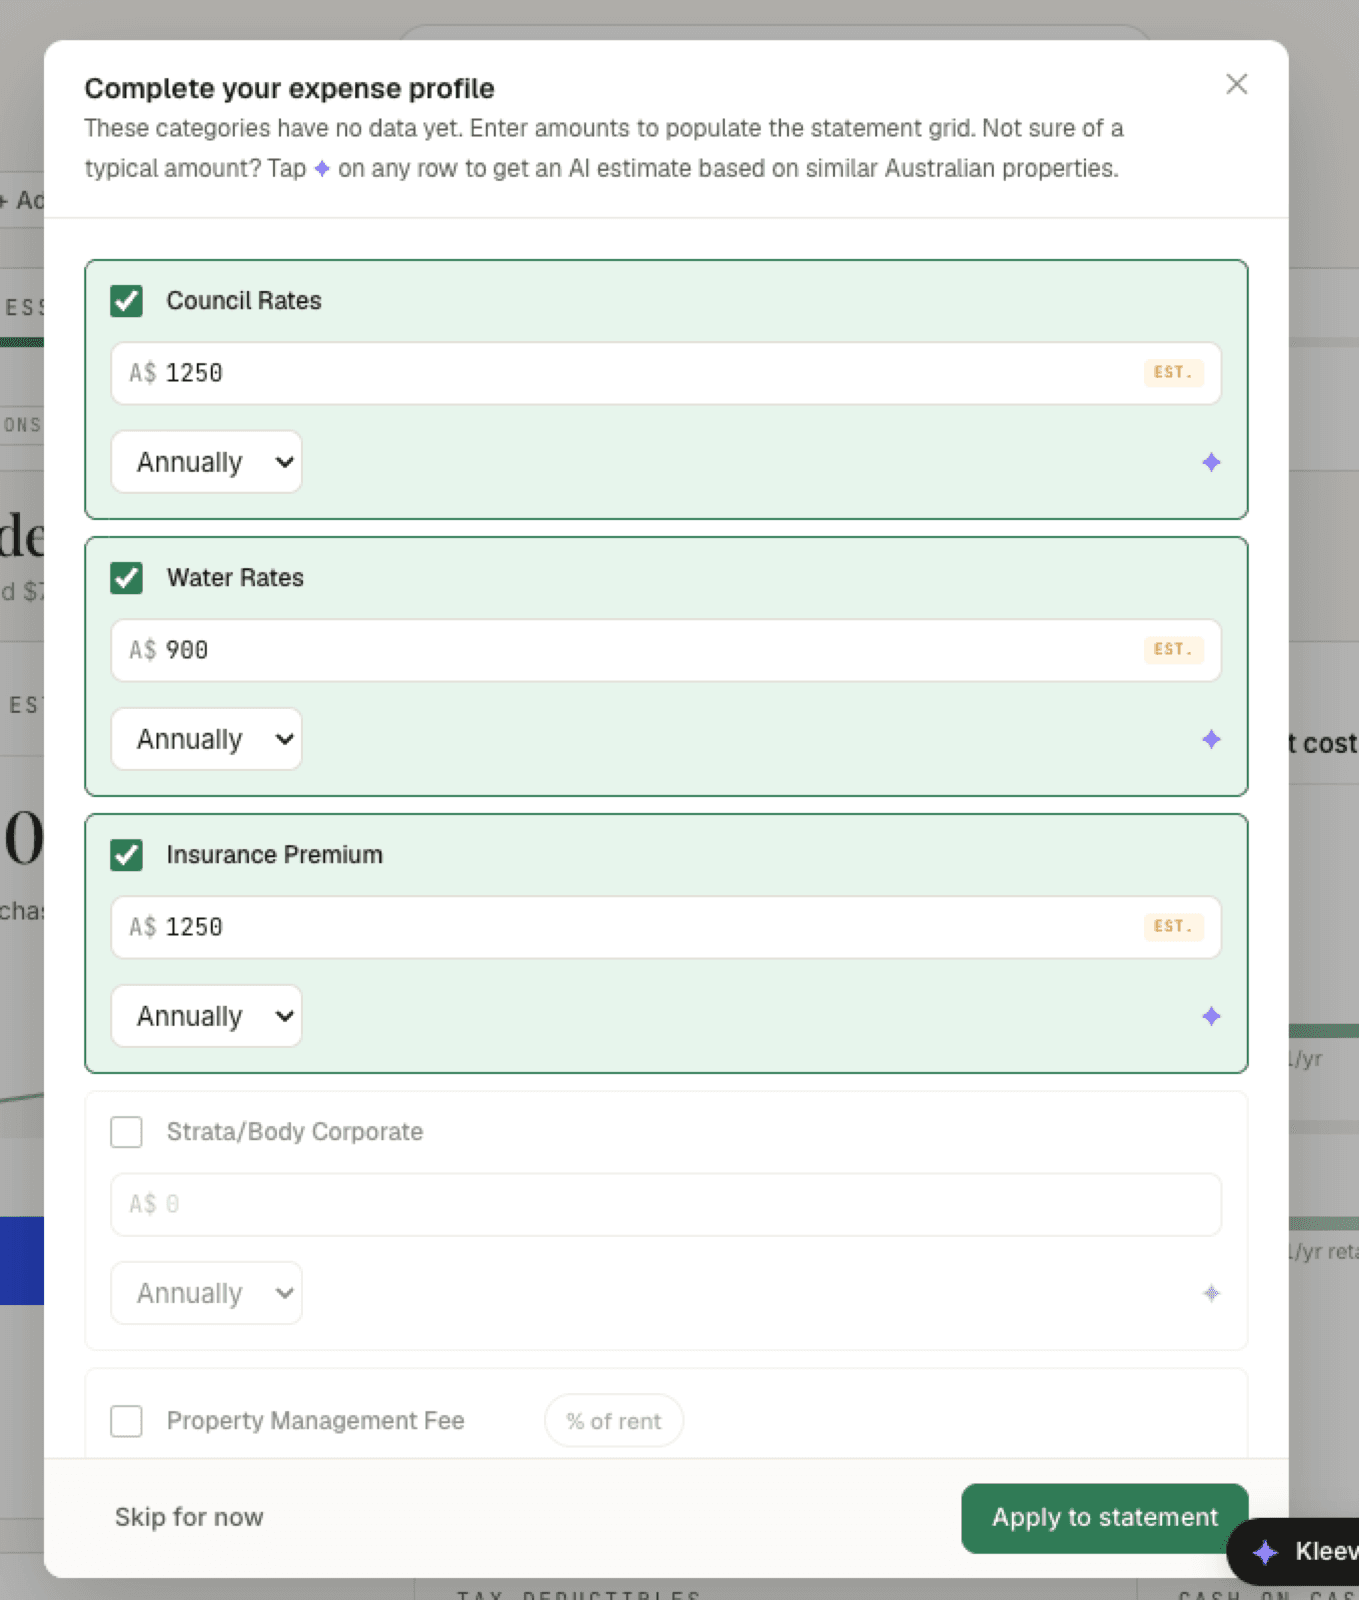
When an estimate lands, the row ticks itself, the amount appears in the field, and it carries a small EST. badge so you can tell it apart from numbers you entered. With ticked rows now holding amounts, Apply to statement lights up.
Your own numbers always win: the moment you type over an estimate, the EST. badge disappears and the value is treated as yours. Use estimates to get a complete picture quickly, then replace them with real figures as bills come in.
Property management fee as a percentage
Property managers usually charge a percentage of rent rather than a flat amount, so the Property Management Fee row carries a % of rent chip. Enter the percentage your manager charges and Kleev works out the dollar amount from the rent you set in basic setup.
Rolling expenses across the grid
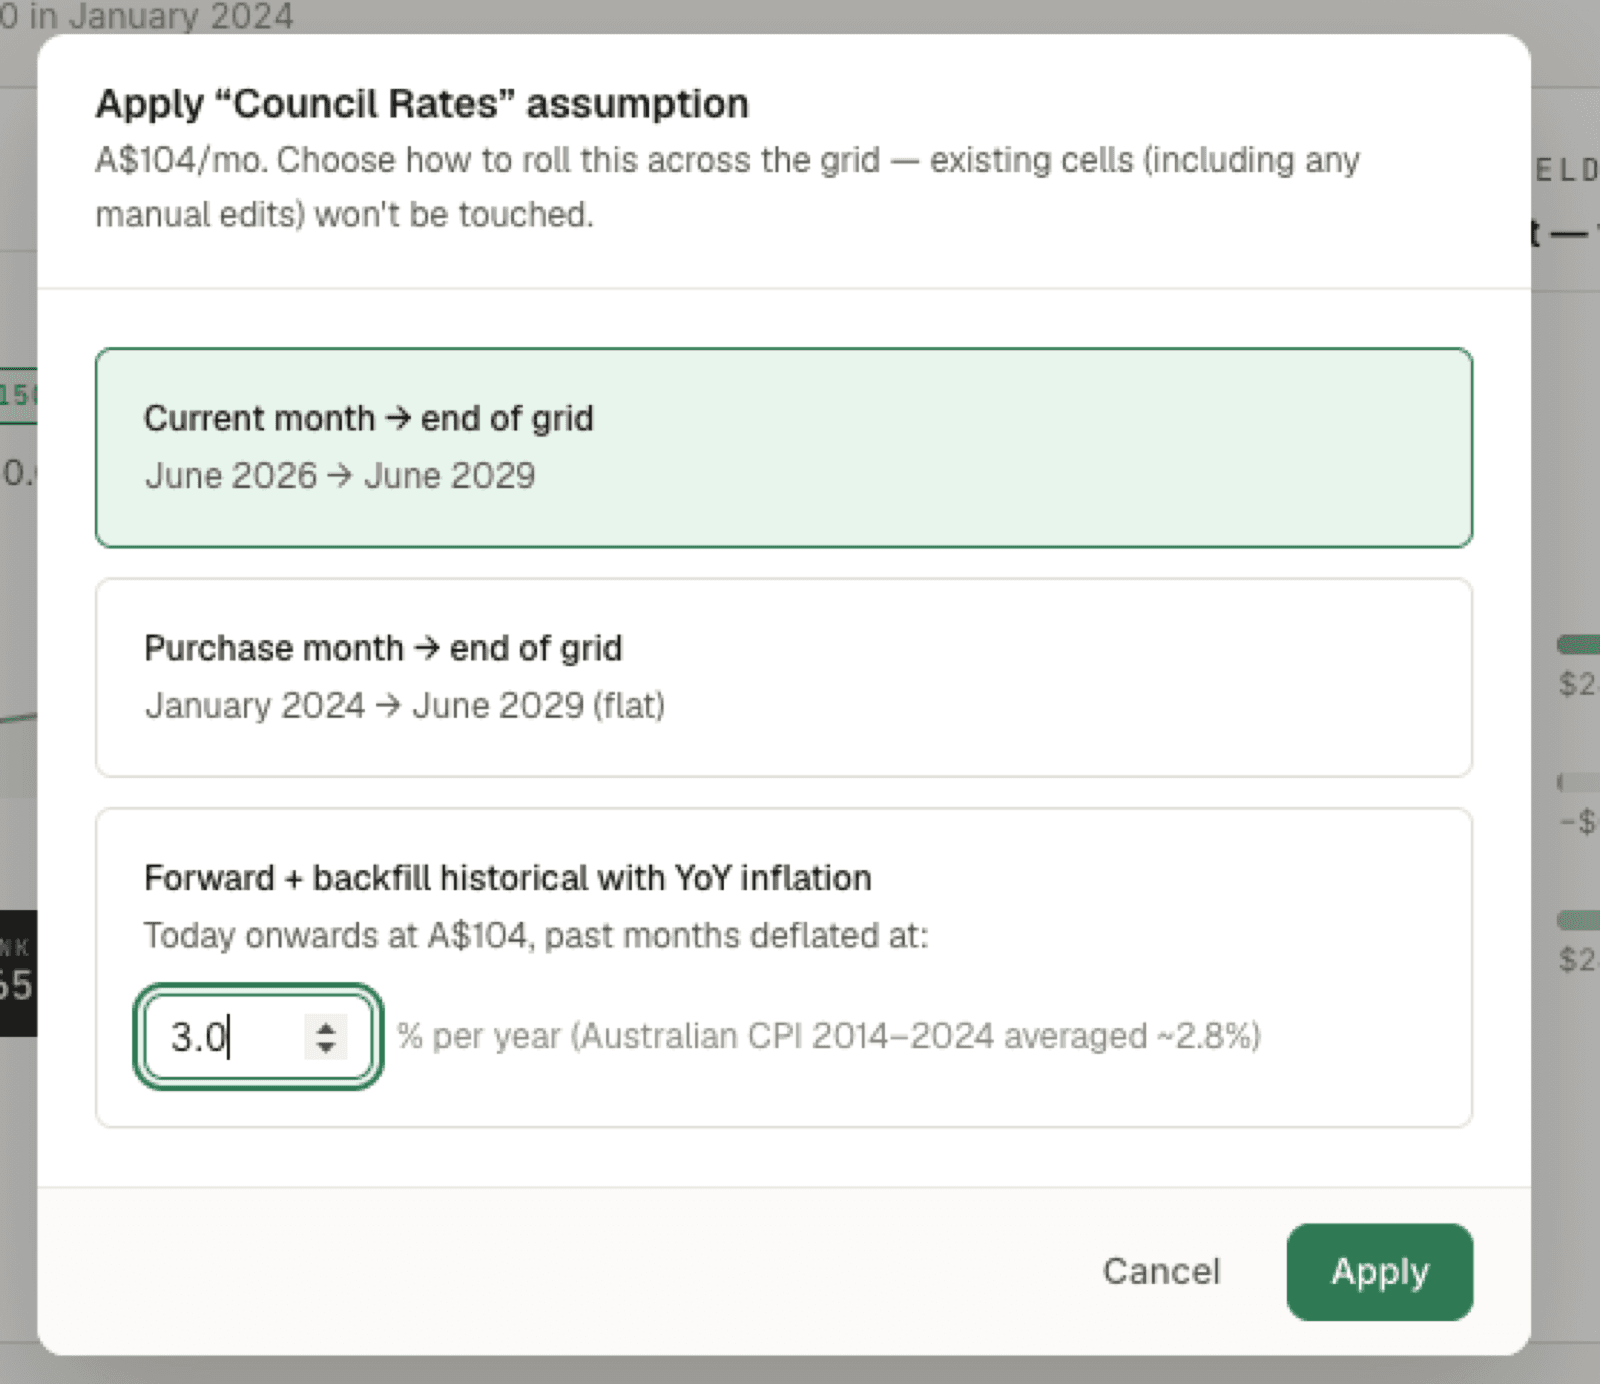
Click Apply to statement and there’s one more question: Kleev quotes each expense as a monthly figure (an annual A$1,250 becomes about A$104/mo) and asks how to roll your expenses across the statement grid. Whichever way you choose, existing cells, including any manual edits, won’t be touched. The three options:
- Current month → end of grid: fill from this month forward only, leaving history blank.
- Purchase month → end of grid: fill the whole timeline from the month you bought the property, at the same flat amount throughout.
- Forward + backfill historical with YoY inflation: today onwards at the quoted amount, with past months deflated by a yearly inflation percentage you can edit. It defaults to 3.0%, with a pointer that Australian CPI averaged ~2.8% over 2014–2024.
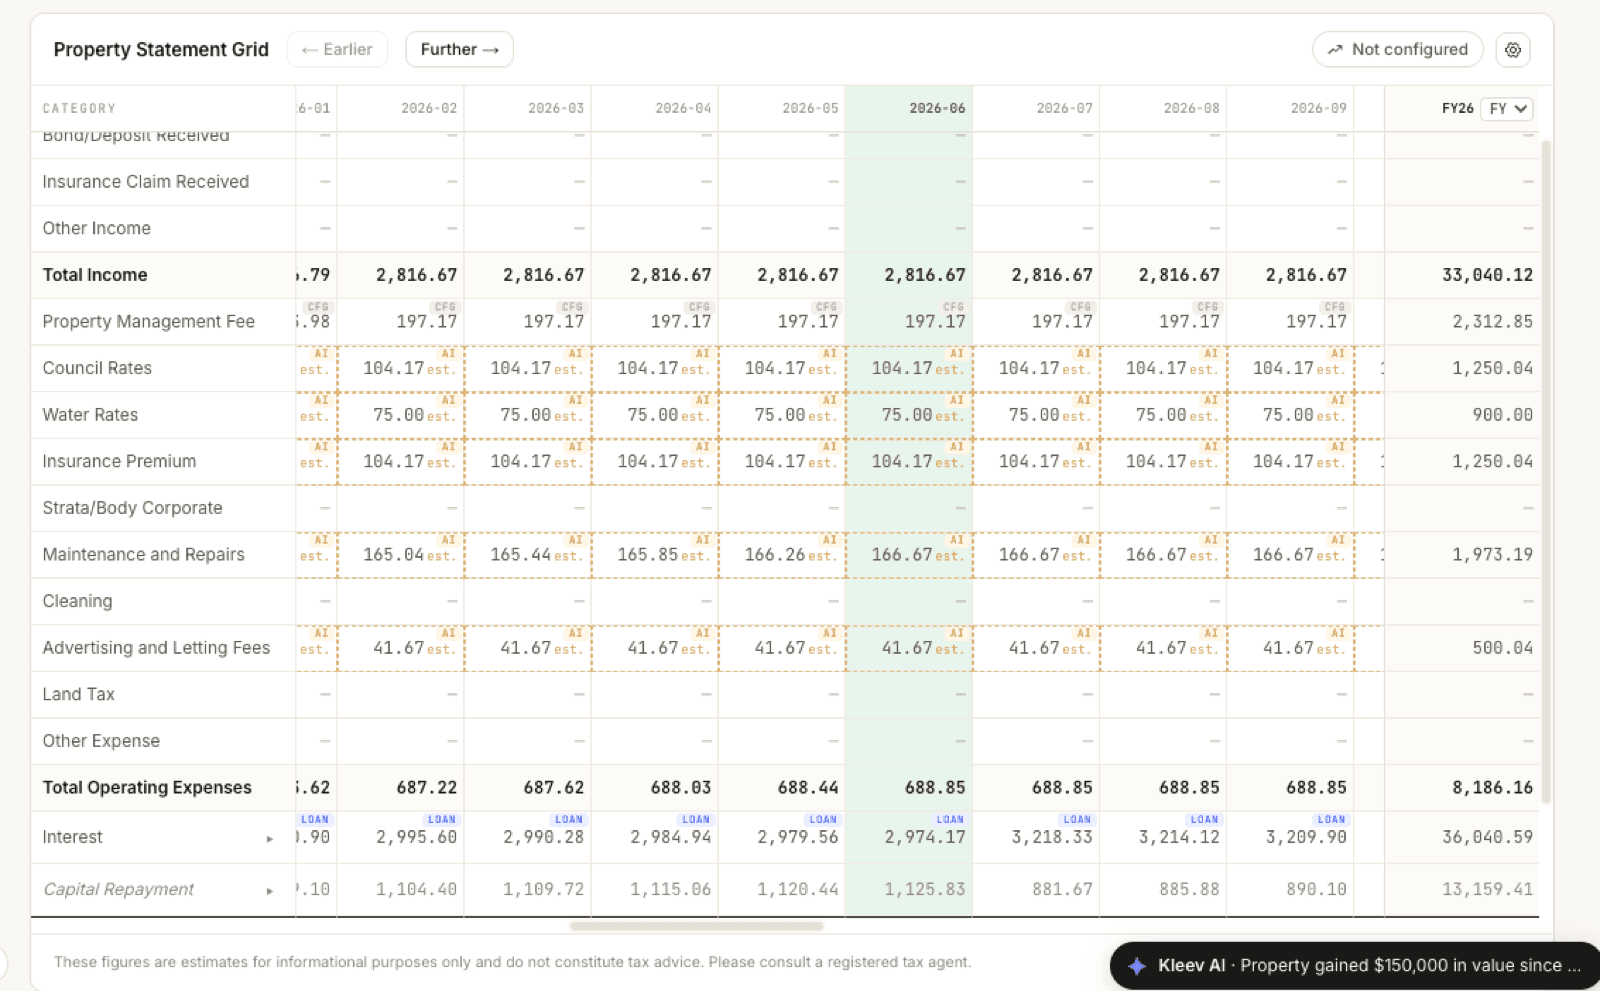
What lands in the grid
Back in the statement grid, the applied amounts appear as monthly figures in amber-dashed cells marked AI est.: A$1,250 a year shows as 104.17 a month, A$900 as 75.00, and so on. The Total Operating Expenses row sums them, the current-month column stays highlighted, and categories you left unticked still show —.
These cells stay estimates. The moment a tagged bank transaction covers a month, or you type a number directly into a cell, the real figure replaces the estimate for that month; see the tagging guide for how TX figures take over.
The Annual Expenses page
The property setup trail also includes an Annual Expenses page, which works in yearly figures, one amount per category, per year, with a running annual and monthly total at the bottom. Enter what you know and click Save expenses. Saved figures feed the property’s tax and cashflow summaries, and flow into the statement grid as monthly estimates (the annual figure ÷ 12), shown there with the Cfg badge until a tagged bank transaction or a number you type replaces them.