Investment property spreadsheet vs app: where spreadsheets break
A spreadsheet is genuinely fine for your first property, and we'll happily tell you when it is. It breaks in three predictable places: retyping statements every month, modelling an offset's daily interest, and forecasting years ahead. Here's what to track either way, and how to tell when you've outgrown the grid.
The short version
- A spreadsheet is genuinely fine for one property and a simple loan, and plenty of investors run years on one.
- It breaks in three predictable places: retyping statements month after month, modelling an offset's daily interest, and forecasting equity and payoff dates years out.
- Whichever tool you use, track the same things: rent, interest and principal separately, expenses by category, offset balance, value, and your capital costs from day one.
Ask us whether you need an app to track your first investment property and we'll give you an answer most software companies won't: probably not yet. A spreadsheet you actually maintain beats an app you never open, and for one property with a simple loan a spreadsheet covers almost everything.
So the useful questions are what needs tracking, and at what point the spreadsheet version of that starts costing you evenings. We'll answer both.
What should you track for an investment property?
The list is the same whether it lives in a spreadsheet or an app. You track money in, money out by category, the loan's moving parts, and the property's value.
The table below is the full set, and those are your columns if you're setting up a spreadsheet today. We also keep a day-one checklist for first-time investors that covers the documents behind them.
| What to track | Why it matters | How often |
|---|---|---|
| Rent received | Income for your tax return; gaps reveal vacancy cost | Every payment |
| Loan interest (not principal) | Usually your biggest tax deduction, and only the interest counts | Monthly |
| Loan principal / balance | Your equity position and payoff trajectory | Monthly |
| Offset balance | Determines the interest you're actually charged | Monthly or better |
| Expenses by category | Rates, insurance, management, repairs, strata, water: each feeds tax time | As they land |
| Capital costs | Stamp duty, conveyancing, improvements: matter for CGT when you sell | As they happen |
| Estimated value | Drives your equity and LVR | Quarterly or so |
| Depreciation schedule | Paper deductions many investors forget to claim | Once, then yearly |
The tracking list is tool-agnostic: same columns in a spreadsheet, same fields in an app.
When is a spreadsheet enough?
A spreadsheet is enough while the data stays small and the questions stay simple. That means one property, one loan, a dozen or so transactions a month, and questions like "what did insurance cost this year?" that a sum over a column answers.
A spreadsheet has real advantages at that scale. You see every formula, you can shape it exactly to your situation, it costs nothing, and building it teaches you how your property works.
If that's where you are, our sincere advice is to keep the spreadsheet and spend your energy keeping it current.

Where do spreadsheets break?
Spreadsheets break at three specific points, and they arrive on a schedule you can predict.
Break one: typing in the statements
Every month your lender produces a statement, your agent produces a rent summary, and your bank produces the expense trail. None of it enters the spreadsheet unless you type it.
Fifteen minutes a month sounds like nothing until it's month fourteen and you're rebuilding a quarter from PDFs because you fell behind in March. Most property spreadsheets die of unentered months rather than bad formulas.
Break two: modelling the offset account
Offset interest accrues daily on the loan balance minus that day's offset balance, and a monthly spreadsheet row cannot see that. You can approximate with monthly averages, and the approximation is usually fine.
Then you want to answer a real question, like "what happens to my payoff date if I move $400 a fortnight into the offset?". Now you're rebuilding an amortisation calculation in cell formulas, which is a fun weekend if you like that sort of thing, and also where most people's error bars grow bigger than the effects they're measuring.
Break three: forecasting years ahead
"Where does this sit in five years?" needs compounding growth on the value, an amortising loan underneath it, offset behaviour on top, and inflation on the expenses, all interacting at once.
Each piece is high-school maths, but the combination is a model, and homemade models degrade as formulas get pasted over and assumptions go stale. When the answer to "can I afford the second property?" rides on it, that degradation is a genuine risk, and it's the point where we'd stop trusting ours.

What does an app actually do differently?
An app gets the data in without you typing it. Kleev reads your lender statements and bank CSV exports and turns them into a living model of the property: the loan and its interest-versus-principal split, the offset balance and what it's saving, and rent landing against expenses going out.
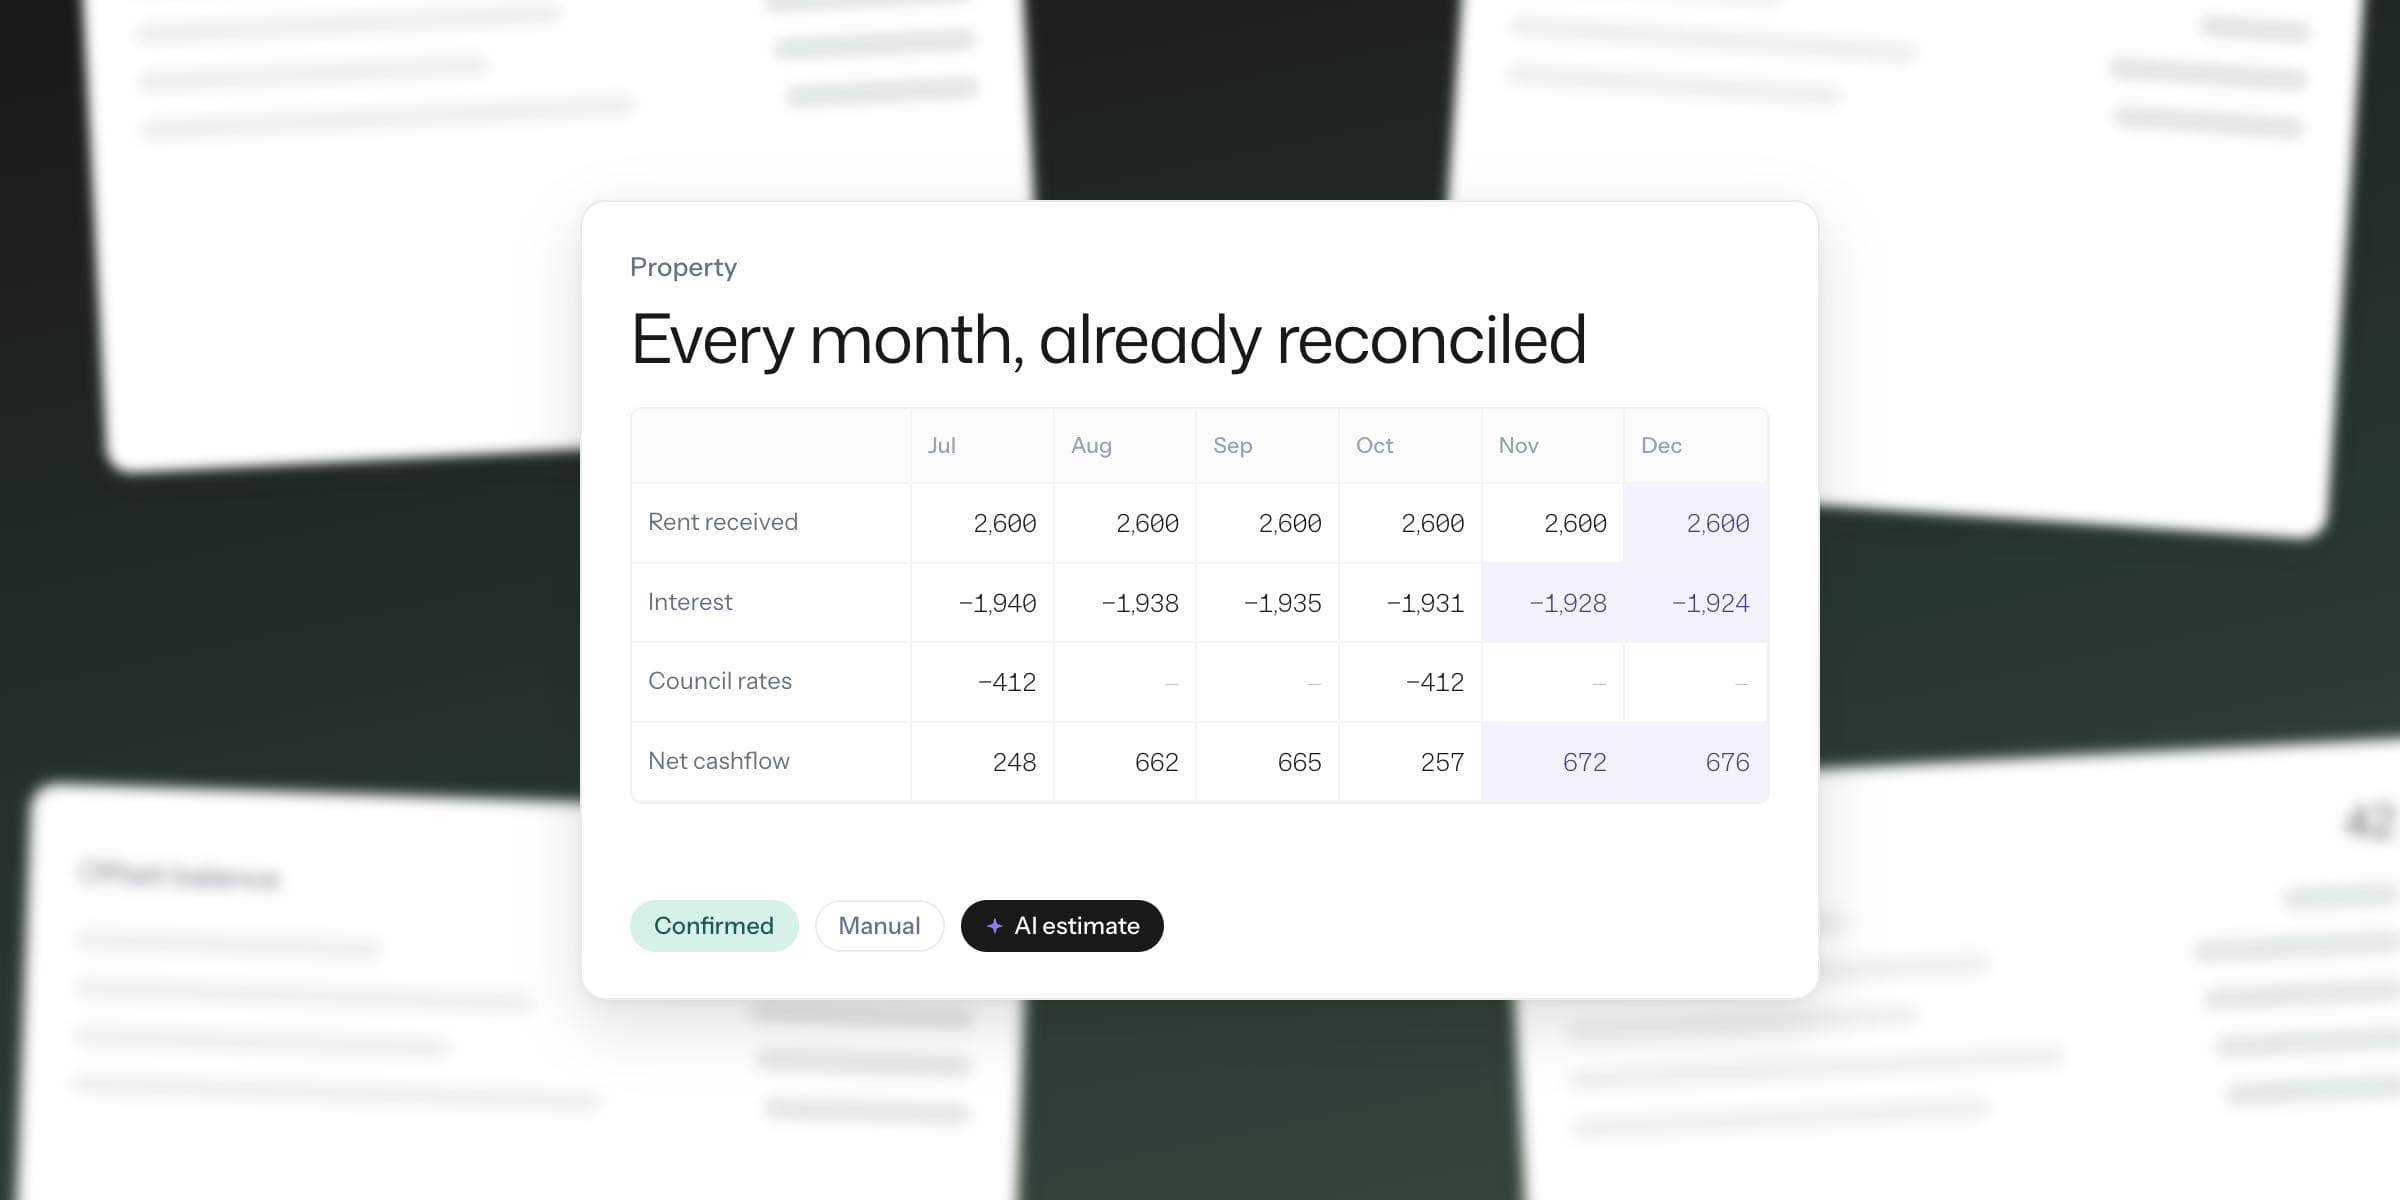
All of that stays current as statements come in, rather than being rebuilt at tax time. The statement grid lays the year out like the spreadsheet you were keeping by hand, categories down the side and months across the top, except each cell traces back to a real transaction.
The forecasting comes pre-built too, so you don't have to write it in cell formulas. You get offset what-ifs three ways (a monthly deposit, a target balance, or a growth rate) with the payoff date and interest saved recalculated live. Come July, the expense records are already organised for tax time.
What does a spreadsheet still do better?
Anything bespoke. If you want to model a subdivision, or a granny flat's rent against its build cost, or your own unusual scenario, a spreadsheet gives you freedom that an app's structure will fight.
Plenty of sharp investors run both. The app carries the record keeping and the spreadsheet carries the experiments, and there's nothing wrong with that split.
How do you know when you've outgrown the spreadsheet?
- You're more than two months behind on entering statements, or you've started guessing instead of entering.
- You have an offset account and your spreadsheet models it annually (or not at all).
- A second property, or a serious plan for one, has arrived, roughly doubling the admin and the forecasting stakes.
- Tax time means an afternoon of reconstruction rather than a read-off.
- You've caught a formula error that had been wrong for months, and you're no longer sure it was the only one.
If a few of those ring true, the spreadsheet has done its job and taught you the mechanics. Let software carry the admin from here.
Drop a lender statement and a bank CSV into Kleev and the property model builds itself from your real numbers. See your property as a living model in Kleev →
One note before you build anything
- Kleev describes your own data and does not give financial advice.
- Whichever tool you choose, the habit matters more than the software: numbers entered (or imported) promptly beat any model built on stale data.
Common questions
Is a spreadsheet good enough to track an investment property?
For one property with a simple loan, yes. A well-kept spreadsheet tracking rent, loan interest, expenses by category and the property's value covers what most first-time investors need. Spreadsheets strain once you add an offset account (daily interest is painful to model), a second property, or the monthly grind of retyping statements by hand.
What should I track for an investment property?
Track rent received, loan interest and principal separately, the offset balance if you have one, every expense by category (rates, insurance, management fees, repairs, strata, water), the property's estimated value, and your one-off capital costs from purchase. Interest and expenses feed your tax return each year; capital costs matter when you eventually sell.
Where do property spreadsheets usually break?
Three places: data entry (retyping lender and bank statements every month, which is where most spreadsheets quietly die), offset modelling (interest that accrues daily on balance-minus-offset doesn't fit a monthly grid), and forecasting (projecting equity, cashflow and payoff dates years ahead outgrows homemade formulas fast).
What does a property tracking app do that a spreadsheet can't?
The main difference is that data arrives instead of being typed: an app like Kleev reads lender and bank statements into a live model of the loan, offset and cashflow, keeps categorised expense records for tax time, and runs offset and growth forecasts on real numbers. The trade-off is less freedom to build exotic custom calculations than a spreadsheet gives you.